
TL;DR Summary
SaaS growth runs on four levers: acquisition, activation, retention, and referral. Most teams pour 80% of their effort into acquisition, which is the weakest of the four. Improve all four by 15% each and the compounding effect is roughly 75%. Before you raise ad spend, check whether your cohort retention curve flattens. If it never does, more traffic just burns cash faster.
Most SaaS growth strategies fail because teams add more people at the top while neglecting the lower levels.
I encounter this situation frequently. The founder is pleased when signups rise, but a fifth of paid accounts leave every quarter, and people never connect those facts.
Increasing advertising expenditure won't cure that problem; it will only make the gap cost more.
This article won't list tactics. Instead, it explains four factors that affect a software business, the math behind each one, and how to find the one causing trouble in your company.
Why More Traffic Won't Fix a Leaky Product
Once you do the churn math, the result should make you uneasy.
Each month you lose 5 percent of your customers, so after a year, about 54 percent remain. Half your original base has vanished, even though your hosting bill has not gone down.
Take churn to 6 percent. Start with 1,000 signups, and after twelve months you will have 476 accounts remaining.
You would have to earn $52,400 each month to return to the starting point.
This section has a financial impact. It is not hindered by traffic; in fact, it causes more people to leave, since you are charging them the full amount in cases where those individuals leave without paying you back.
Prepare your cohort curves before using your advertising budget, then plot retention by the month in which signups took place.
Healthy products usually fall in value over two or three months before stabilizing. The group that enters the stabilized phase is made up of people who have found something worthwhile to keep.
Sick products continue to drop down towards zero without reaching a lowest point.
The fact that there is no floor shows you're not dealing with a traffic problem; instead, you have a product problem and are presenting it as a marketing issue.
One more thing, and it's the one I'd do first: separate the curves by channel, by plan, and by job title. Each time I do this, the same result emerges: the large paid channel leads in the number of people who quit, whereas a very small referral channel draws in the accounts that stay for years.
That one chart has changed more budgets than any of the others I've provided to a founder.
The Four Levers of SaaS Growth
The system comes down to acquisition, activation, retention, and referral.
| Lever | Key Metrics | Focus Areas |
|---|---|---|
| Acquisition | CAC by channel, trial volume | High-intent search, outbound, partnerships |
| Activation | Time-to-value, setup completion | Removing steps before the first win |
| Retention | Net revenue retention, churn | Expansion, habit loops, account health |
| Referral | Invites sent, K-factor | Team workflows, shared links, integrations |
There is no advantage in choosing a four-lever method over a list of tactics, since the levers reinforce each other.
If you raise each figure by 15%, you won't end up with 15%; instead, you'll get 1.15 to the fourth power, which is about 75%. That is simple arithmetic, not the outcome of any particular study. Nevertheless, it shows why four small adjustments are better than one large one.
Most teams spend 80 percent of their week on acquisition, and that work is the weakest of the four.
Lever 1: Acquisition You Can Actually Afford
Sign-up figures alone do not tell you much; you need the cost per customer, the channel used to acquire them, and how quickly you recover the money.
The answer to the previous question is CAC payback: specifically, how long it takes for this customer to repay the money you spent to acquire them.
CAC Payback (months) = CAC ÷ (Monthly revenue per account × Gross margin %)
When CAC is $600, the account pays $100 a month, and gross margin is 80 percent, so you get $80 each month; in this case, the payback period is 7.5 months.
With the self-service option, the target period is from 8 to 12 months, and 14 to 18 months if a salesperson is involved.
By the end of 20 months, you'll no longer be able to support growth solely with your own revenue and will therefore have to secure further funding or stop hiring.
I have done the full calculation—covering LTV, gross margin, and the LTV: CAC ratio—in my explanation of SaaS unit economics. If that section wasn't clear, go look at it instead.
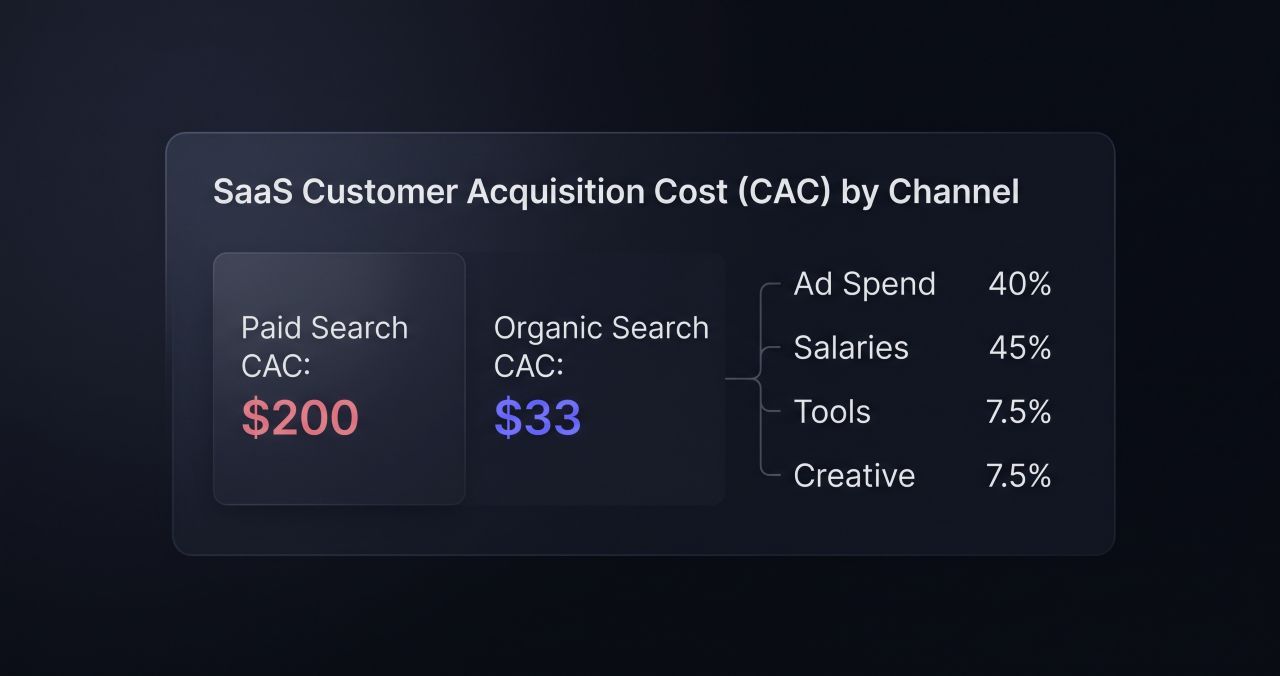
Do not look at combined CAC on its own. For example, if an organic customer costs $33 and a paid customer costs $200, their average is $100, and that average hides the full picture.
Lever 2: Activation, Where Churn Actually Gets Decided
Activation is the time between signing up and getting something useful from your product.
Most cancellations are settled right here, about a week before they actually occur; the person joins, goes to the setup screen, fails to make the connection, never invites a colleague, and then stops opening the tab.
They cancel in the third month; you call that churn. It was not churn. It was only a poor first Tuesday.
Four questions to answer honestly:
- When do you first think "that's useful"?
- What number of minutes and how many clicks does that presently demand?
- At what point do people leave before they reach their destination?
- What early action is a predictor of who is still around in the sixth month?
The last one is the most valuable; identify the action that distinguishes those who stay from those who leave, then reform the onboarding process so every element focuses on it.
Then cut the rest too—each optional field, each tour step, and each prompt to complete profiles can cause someone to give up.
If I want to explain the reason for this kind of behavior in more depth, I treat user behavior and systems thinking separately.
Lever 3: Retention, Where the Compounding Happens
Retention is the only factor that makes all the others cheaper.
Reducing churn from 5 percent to 3 percent increases lifetime value by about two-thirds. Pricing stays the same, and acquisition costs do too. All you did was stop losing customers, and a customer acquisition cost that was unaffordable last quarter is now acceptable.
Here, record two numbers, not just one.
Count the number of logos that leave, and track net revenue retention for the dollars, along with any upgrades and additional seats.
They can move in opposite directions, and that is acceptable. Many well-run businesses cancel smaller accounts while expanding their more profitable ones. If your net revenue retention rate is above 100 percent, your existing customers will fund your growth even in a month when you do not sign any new clients.
That is what software considers a cheat code.
To find the full dashboard, which shows that checks should be made weekly rather than monthly, refer to my SaaS metrics guide. For the LTV calculation itself, SaaS customer lifetime value provides a step-by-step explanation.
Lever 4: Referral Loops Built Into the Product
The referral scheme isn't something you add to your product in the ninth month; successful loops are built in from the start.
Think about what your users do anyway that drags someone else in:
- Inviting a teammate to review something
- Sharing a link with a client
- Connecting a tool a coworker also uses
Growth mechanics, zero fluff.
Join 2,000+ SaaS founders getting weekly tear-downs on organic acquisition and churn reduction.
- Exporting a file with your name on it
If you make one of them easy with a single click, you have created a loop.
Most products don't have a real loop, and forcing one usually creates spam. If your product is truly single-player, place this lever last and use that time for activation.
How to Pick Which Lever to Pull First
Leave the other three alone, and run the diagnosis first before selecting one.
| Scenario | Primary Lever | Focus Metrics |
|---|---|---|
| Signups fine, users vanish in week one | Activation | Time-to-value, setup drop-off points |
| Users stay active but cancel anyway | Retention | Pricing fit, missing features, support gaps |
| Everything retains, growth is slow | Acquisition | Channel CAC, search visibility, intent match |
| Good product, no word of mouth | Referral | Invite friction, sharing surfaces |
| Revenue grows, cash gets tighter | Acquisition | CAC payback, annual prepay, sales cycle |
Carry out one experiment using one lever. Record your hypothesis and select an end date before you begin. This is the method used in my SaaS growth experiment framework.
When acquisition is the bottleneck and the budget is limited, I normally begin with organic search; I have outlined that in my SEO strategies for SaaS.
My Honest Take
Most teams don't need a new growth strategy; they need to stop doing three things at the same time.
Select the faulty lever, repair it, and then check if the cohort curve has moved. Then move on to the next one.
The teams that have been growing most rapidly aren't the most creative; instead, they have been patient with the process.
FAQs on SaaS Growth
What are SaaS growth strategies?
The growth strategies employed by a software company consist of the systems it uses to attract users, help them realize value quickly, keep them paying, and then turn them into a source of new users. The four main levers are acquisition, activation, retention, and referral.
What is the most important growth metric in the early stages of a SaaS company?
The payback period of CAC shows how long cash remains tied up with each customer, and it determines whether you can finance your growth yourself or have to raise funds.
What can be considered a good churn rate in the context of SaaS?
With self-serve B2B products, a monthly logo churn rate under 3% is usually considered healthy, and under 1% is seen as strong. Enterprise SaaS companies typically use annual figures for this measure. A better way to assess the situation is to see whether your cohort curve levels off.
Should I spend money on ads, or should I improve retention first?
Yes, generally speaking. If your retention curve doesn't level off, increased traffic will burn through cash faster. You should repair the leak before increasing the scale of the channel.
How long do you need to wait before you notice the results from a growth lever?
Activation changes become visible after two to four weeks. For retention changes, you need to wait for the entire cohort cycle, which is 60 to 90 days. Organic acquisition may take three to six months. So plan your experiments to align with those time periods.
Where to Go Next
Well, intentional boring is a key feature of good SaaS growth strategies. Find the leak, repair it, check the curve, and then repeat the process.
For the numbers side, start with SaaS unit economics. To see the levers applied to real experiments with real outcomes, failures included, browse the case studies.
I write up every experiment I run either way. If that's useful, join the newsletter, and you'll get the next one as it happens.